These Tuscaloosa, Alabama Intersections are Pure Nightmare Fuel
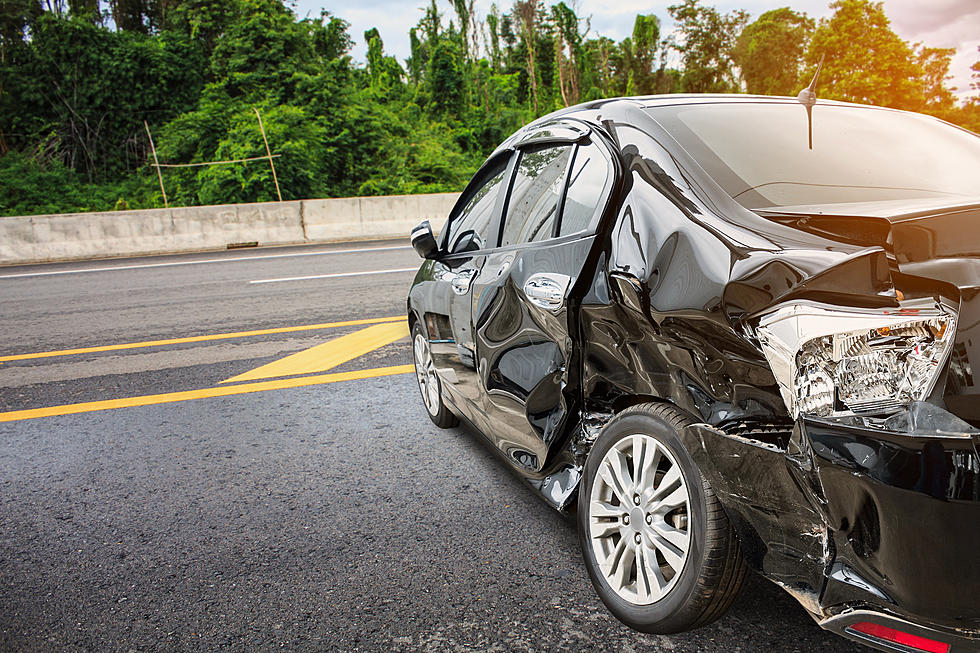
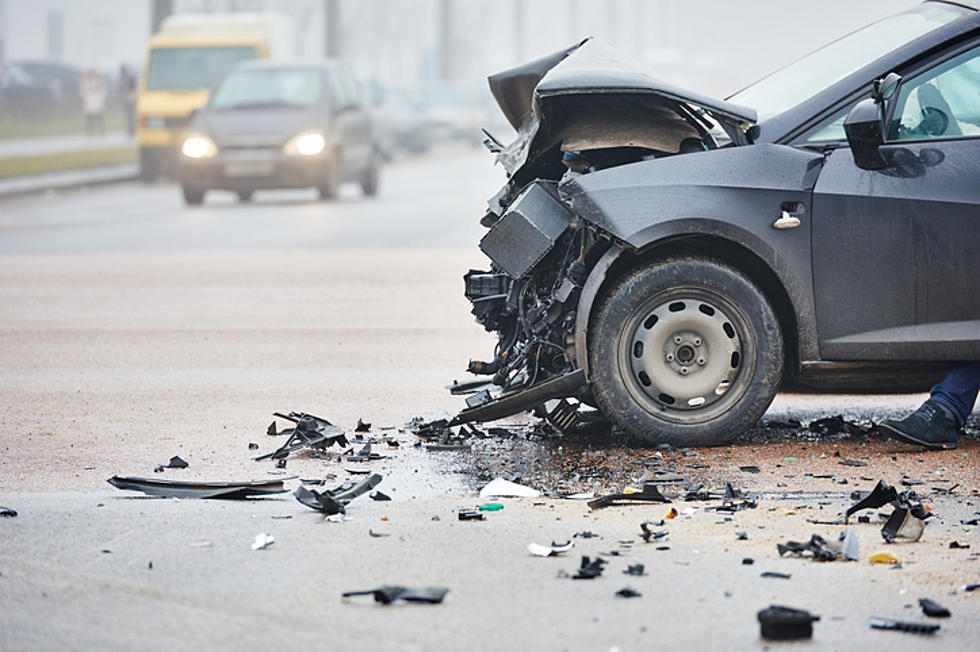
I have so many questions about traffic and accidents in Tuscaloosa, Alabama. It seems like every time I drive down McFarland Boulevard. I'm praying for my life. Either someone is on their phone texting, speeding, or worse like blowing through intersections when the light is red.
Several times in the past few weeks, while driving on McFarland Boulevard, it's been an accident every time. But, but McFarland Boulevard is not the only sore spot for driving. The list goes on and on.

What I can't understand is accidents at intersections with traffic light signals. Lookup; there is a traffic light signal. It's like nobody pays attention anymore.
Red means STOP
Green means GO
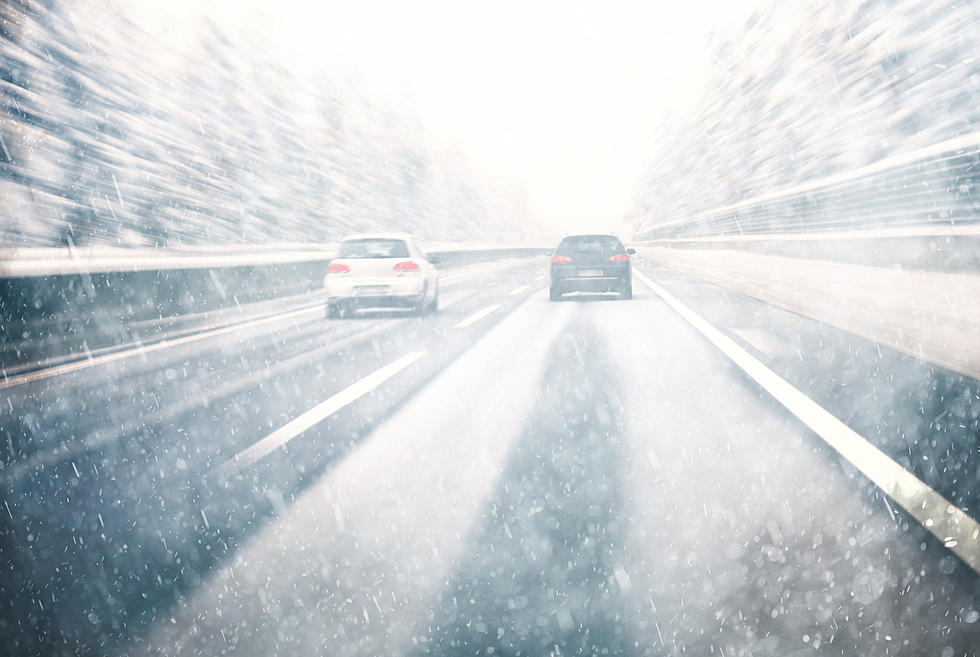
Yellow means caution and that a red light is about to appear. Or, in Alabama, it means speed up and make the light. This is what I call pure nightmare fuel.
My pattern of driving is to avoid McFarland Boulevard at all costs. I'll go a long way, the back roads and all. I drive a Prius, so it's only a couple of pennies more.
Here is what I think are the worst intersections in Tuscaloosa, Alabama. If you have any more, click here to email them to me. Everyone should know and be on guard because nobody has time for their car insurance to go up because someone else can't drive.
Tuscaloosa, Alabama Worst Intersections
See the Must-Drive Roads in Every State
LOOK: See how much gasoline cost the year you started driving
READ ON: See the States Where People Live the Longest
More From 105.1 The Block